New Trace Explorer With Span-Based Metrics
Learn how to use the new Sentry Trace Explorer to search span data, find distributed traces, and debug performance issues across your entire application stack.
The new Trace Explorer is currently an Early Adopter feature, to use it you will need to enable your Early Adopter status. If you are not an Early Adopter, you will still see the classic Trace Explorer.
The Trace Explorer in Sentry is designed to make performance investigation easier and more intuitive. You can now explore span samples, visualize span attributes, and aggregate your data with flexible queries and filters. This guide will walk you through the key concepts and features of the Trace Explorer.
- A trace represents a single transaction or request through your system. This includes things like user browser sessions, HTTP requests, DB queries, middleware, caches and more.
- It captures a series of operations (spans) that show how different parts of your application interacted during that transaction.
- Each trace is identified by a Trace ID, which you can use to follow a request across services or projects.
- A distributed trace is composed of spans that traverse multiple servers, clients, edge workers, etc. and is assembled by passing the Trace ID through browser headers.
- A span represents an individual operation within a trace. This could be a database query, HTTP request, or UI rendering task.
- Each span has:
- Attributes: Key-value pairs like
http.method,db.query,span.description, or custom attributes likecart.value, provide additional context that can be useful for debugging and investigating patterns. These are either numbers or strings. Note: numeric span attributes can be used to calculate span metrics, shown below. - Duration (
span.duration): The time the operation took, used to measure performance.
- Attributes: Key-value pairs like
- Span metrics are derived from applying a function to your span attributes (default or custom), like
p50(cart.value)orsum(ai.token_use), over a granular time frame. This calculation extrapolates metrics that then populate dashboards, alerts, etc. based on that rolling time window. - These 'metrics' aren't stored separately from your span data. Rather, they're queried on the fly. This reduces your need to manage, ingest, and store custom metrics.
- The duration and granularity on which you can query your spans and extrapolate metrics depends on your plan - Developer: 7 days | Team: 14 days | Business: 30 days.
- See your changes in action: Search for
span.domain is localhost:XXXXand sort by Timestamp to see traces from your dev environment. - Diagnosing slow pages: Search for
span.op:navigationand visualizep90(span.duration)to pinpoint slow page loads. - Finding problematic API calls: Aggregate by
http.urland filter whereavg.(span.duration) > 2sto identify slow external API calls. - Database query analysis: Aggregate by
db.queryand sort byavg(span.duration)to find inefficient queries.
With these tools, the new Trace Explorer gives you powerful ways to understand your application's performance, identify bottlenecks, and make informed optimizations.
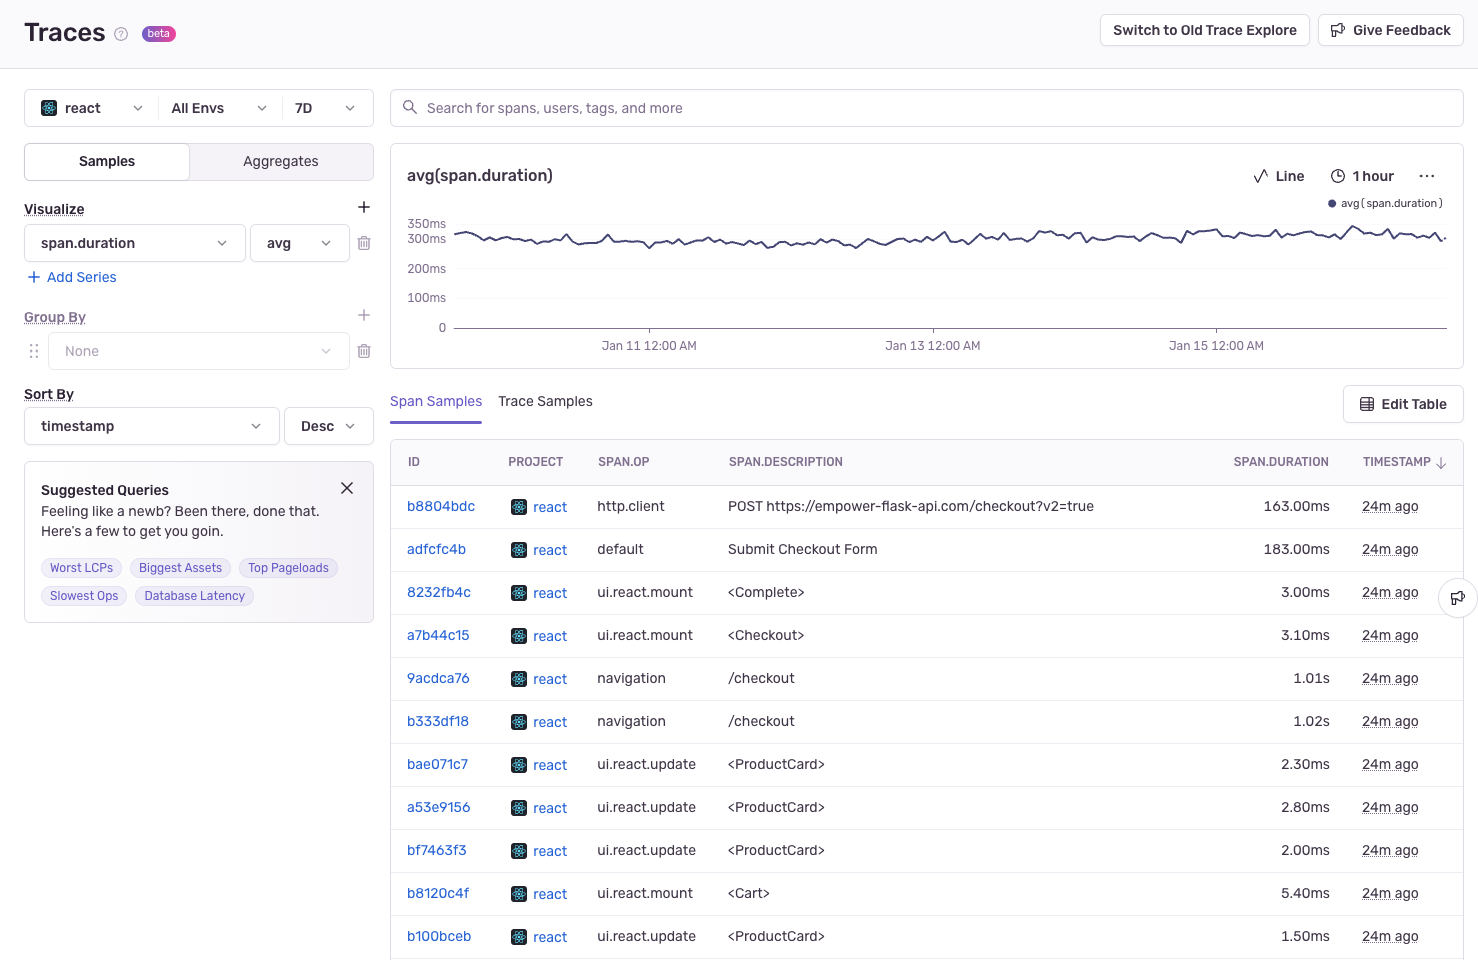
Trace Explorer allows you to browse span and trace samples effortlessly. Here's how:
Search for Samples:
- Use the search bar to filter results based on default or custom attributes, tags, etc. like
http.request_method is "GET - Edit and add columns in teh span samples table to view any attribute
- Sort by clicking the column header to toggle between ascending and descending
- Switch between Span Samples and Trace Samples tabs depending on your focus.
- Use the search bar to filter results based on default or custom attributes, tags, etc. like
Inspect Samples:
- Clicking on a Span ID or Trace ID opens the Trace Waterfall View, showing the sequence of operations and their durations.
- You can explore individual spans in detail or see the trace's overall structure.
Trace Explorer makes it easy to visualize metrics aggregated from any span attribute.
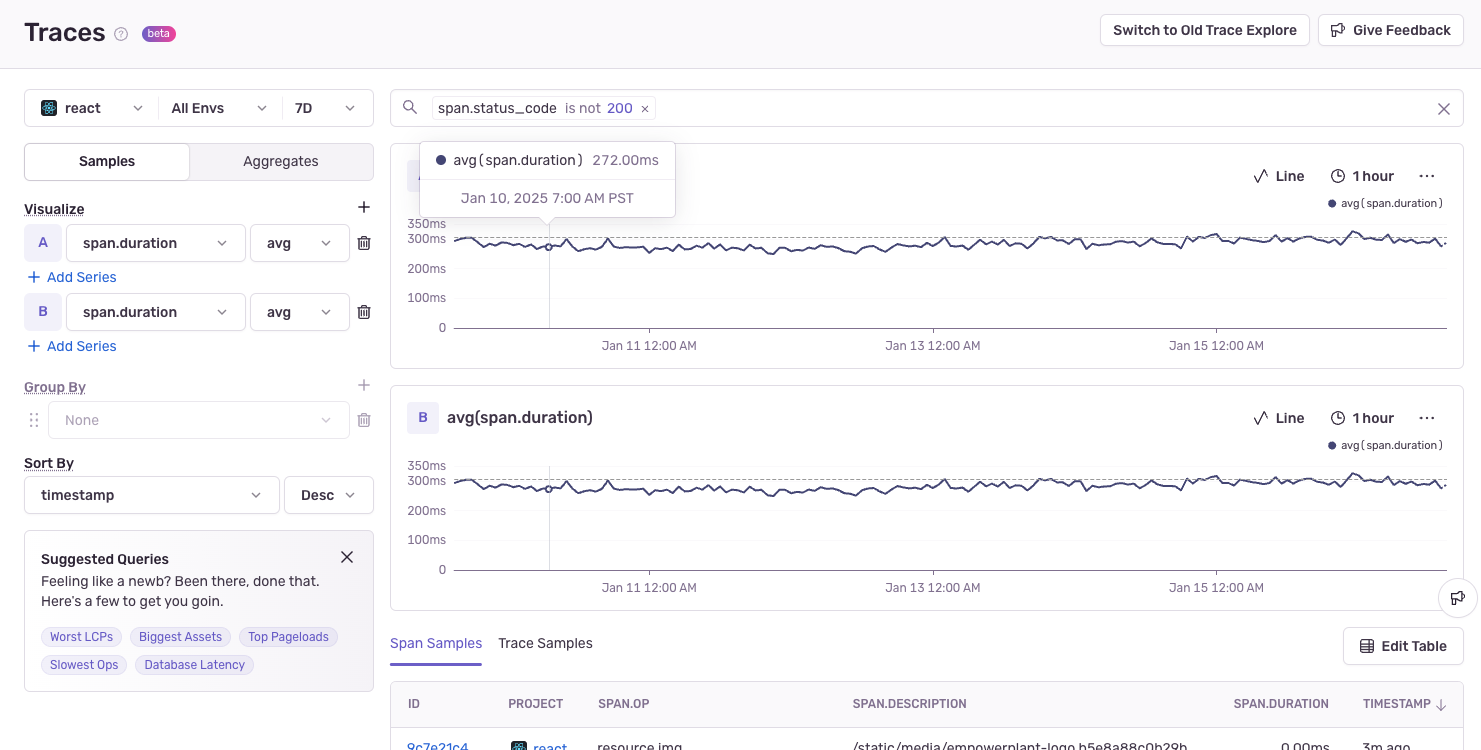
- Set Up Visualization:
- Use the Visualize section to add metrics like
avg(span.duration)orp90(span.duration)to the same chart by clicking Add Series or a different chart by clicking the + icon. - You can also create custom visualizations like:
- P90 of span durations: Useful for identifying outliers.
- Average cache size: Analyze attributes specific to backend spans.
- Use the Visualize section to add metrics like
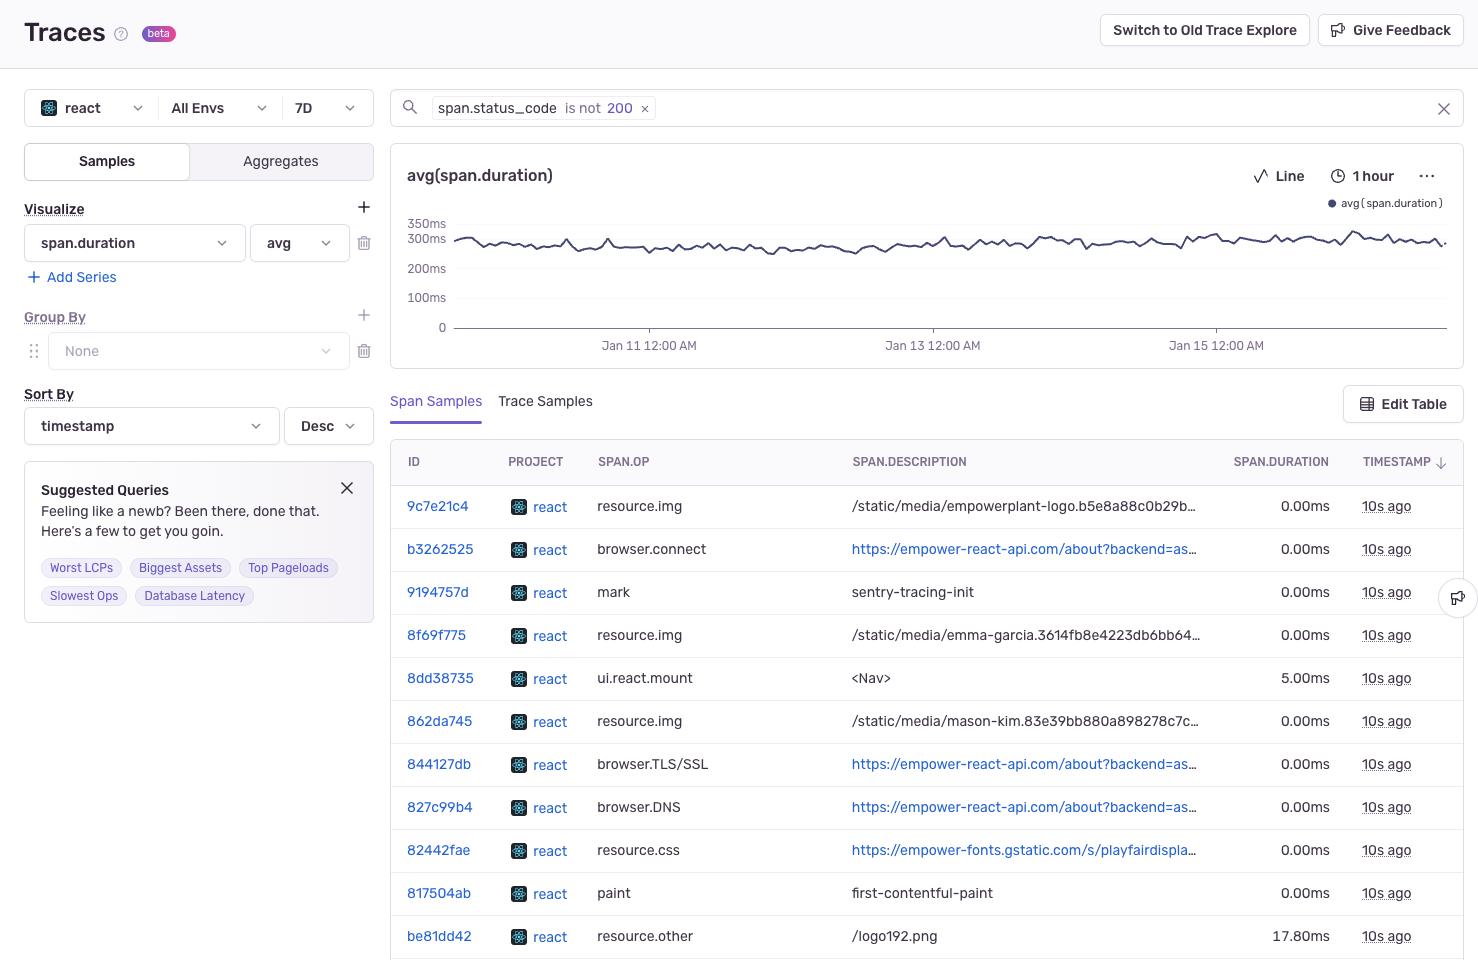
- Filter Your Data:
- Refine your visualization by applying filters in the search bar, such as
span.op:dbto focus on database spans orhttp.status_code:500for errors.
- Refine your visualization by applying filters in the search bar, such as
The line chart updates dynamically as you apply filters, helping you track trends and identify anomalies.

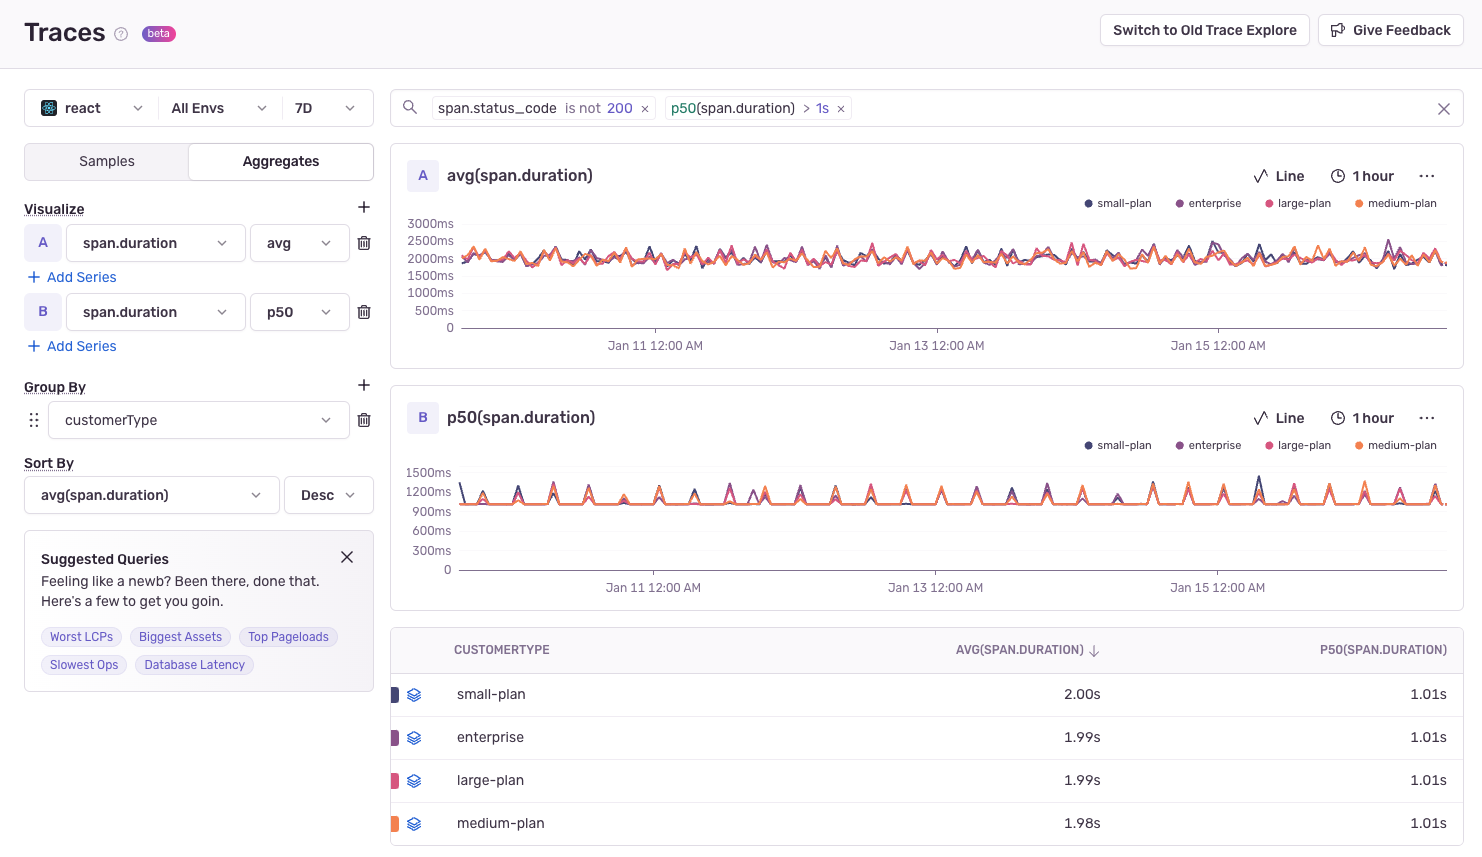
Dive deeper into your data with aggregation capabilities in Trace Explorer.
Enable Aggregate Grouping by clicking the Aggregates toggle.
Group By Attributes to investigate patterns.
- Try
http.methodto compare GET vs POST performance,db.tableto find slow database operations,span.opto investigate patterns in your traces, or custom tags like cart value, CPU or memory usage, or anything else you can think of.
- Try
Filter and sort your aggregates just like you would for transactions by querying in the search bar. Sort the table of aggregates by clicking the column headers (default:
timestamp.)View sample traces that fit your aggregates by clicking the stack icon to the left side of the table rows. Use this to find outliers, debug issues, and find complex performance optimizations.
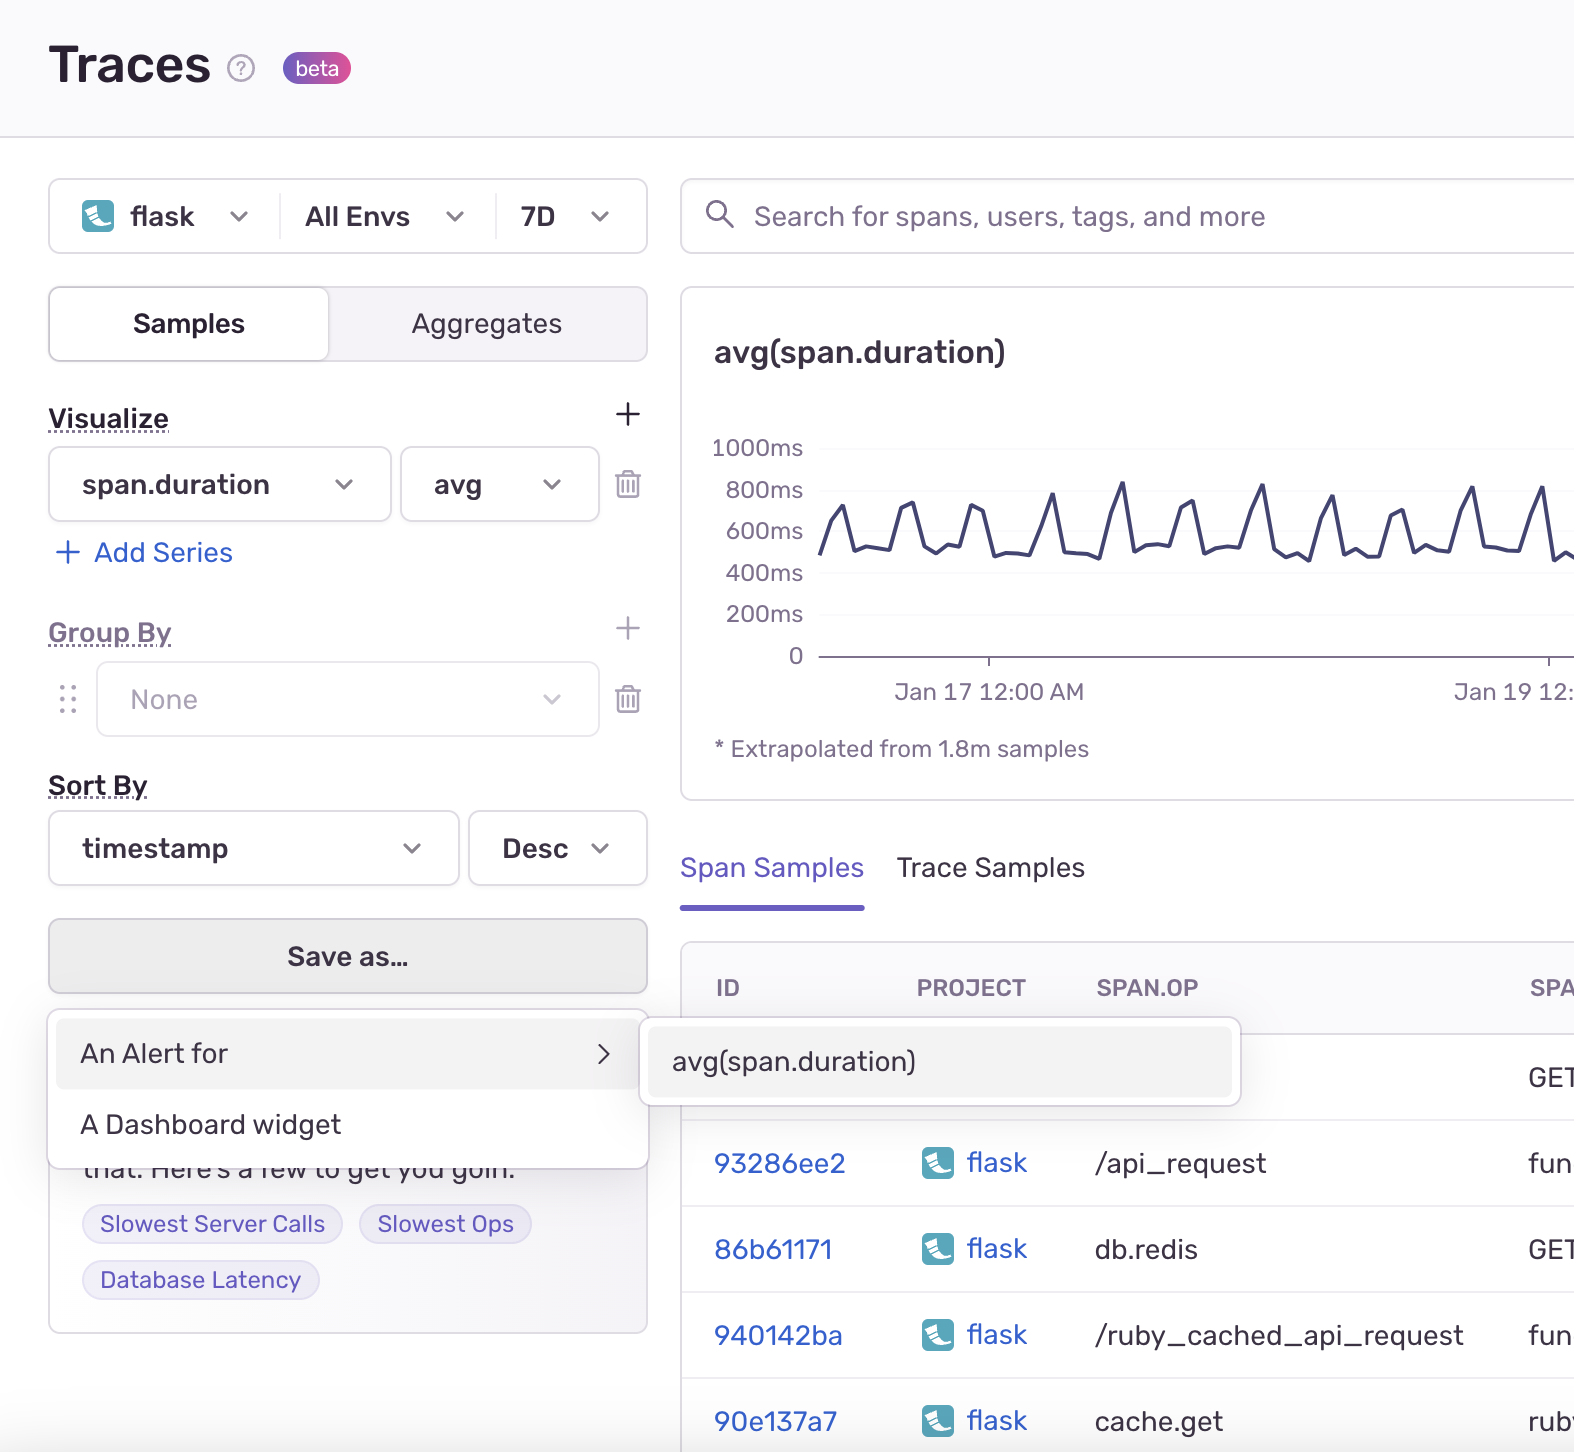
You can create Alerts and Dashboard widgets from your queries by clicking the "Save As" button:
- Diagnosing slow pages:
- Search for
span.op:navigationand visualizep90(span.duration)to pinpoint slow page loads.
- Search for
- Finding problematic API calls:
- Group by
http.urland filter whereavg(span.duration) > 2sto identify slow external API calls.
- Group by
- Database query analysis: Group by
db.queryand sort byavg(span.duration)to find inefficient queries.
You can use Sentry's SDKs to sample spans and control the volume of data sent to Sentry. Not every span gets captured when sampling is enabled, but Sentry will still give you accurate aggregate results by extrapolating the sampled data.
Every span sent to Sentry includes its sampling rate. We also derive the sampling weight, which is the inverse of the rate and indicates the number of original spans that this sample represents.
For example:
- At a rate of 10%, the weight is 10.
- At a rate of 50%, the weight is 2.
- At a rate of 100%, the weight is 1.
All spans you send us after sampling get stored.
When you run queries in Trace Explorer, Sentry uses the sampling weight to compute counts, averages, and percentiles.
Let's say you query for spans where span.op:db and get 2 spans in the results:
| span_id | span.op | span.duration | sampling_factor | sampling_weight |
|---|---|---|---|---|
| a1b2c3 | db | 100ms | 0.1 | 10 |
| d4e5f6 | db | 200ms | 0.5 | 2 |
Since each span was sampled with different weights, Sentry extrapolates the count:
10 + 2 = 12 estimated spans
Trace Explorer will display Count: 12.
Similarly, Sentry incorporates the weight into sum:
10 * 100ms + 2 * 200ms = 1.4s
Trace Explorer will display Sum: 1.4ms.
Averages and percentiles are weighted. You don't just average the 2 spans -- Sentry accounts for the fact that they represent a larger dataset. For example, the weighted average works like this:
(100ms * 10 + 200ms * 2) / (10 + 2) = 117ms (This is the average duration shown)
Sentry treats this as a representation of the average across all 12 estimated spans. You can trust that metrics like avg() and p90() reflect your services' true health, adjusted for sampling.
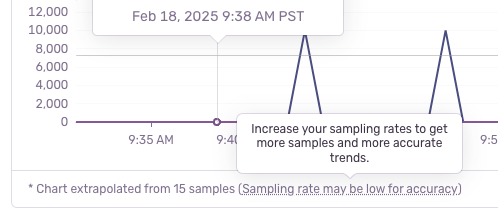
If your sampling rate is too low for an accurate extrapolation (for example, keeping less than 5% of an already low number of spans), Sentry may show a low sampling rate warning. This lets you know that extrapolation might be less reliable, especially for more restrictive queries.
Even if you sample your spans, Trace Explorer's extrapolation gives you reasonably accurate answers for counts, averages, and percentiles -- without you needing to do anything extra.
With these tools, the new Trace Explorer gives you powerful ways to understand your application’s performance, identify bottlenecks, and make informed optimizations.
Our documentation is open source and available on GitHub. Your contributions are welcome, whether fixing a typo (drat!) or suggesting an update ("yeah, this would be better").